The Adjustment Of Weekly Dividend Notification – November 24, 2022

Dear Client,

Warmly reminds you that the component stocks in the stock index spot generate dividends. When dividends are distributed, VT Markets will make dividends and deductions for the clients who hold the trading products after the close of the day before the ex-dividend date.

Indices dividends will not be paid/charged as an inclusion along with the swap component. It will be executed separately through a balance statement directly to your trading account, the comment for which will be in the following format “Div & Product Name & Net Volume ”.

Please note the specific adjustments as follows:

The above data is for reference only, please refer to the MT4/MT5 software for specific data.

If you’d like more information, please don’t hesitate to contact cs@vtmarkets.com.

Trade US CFD Shares with a higher leverage – November 23, 2022

Dear Client,

To provide you with a better trading condition, starting 28 November 2022, VT Markets will increase the leverage of US CFD Shares from 20:1 to 33:1.

Please note that the other specifications for US shares will remain the same as before.

The above data is for reference only. Please refer to the MT4/MT5 software for specific data.

If you require more information, please do not hesitate to contact cs@vtmarkets.com.

Intermediate 10: Understanding Fibonacci

Fibonacci is one of the tools that Forex traders often use. Let’s figure out how the Fibonacci instrument works.

Leonardo Fibonacci, a mathematician from the 1300s, came up with a set of numbers (0, 1, 1, 2, 3, 5, 8, 13, 21, 34, 55, 89, 144, etc.), with every number in the list the sum of the two numbers that came before it. The relationship between these numbers is the same as in nature. For example, tree branches grow or split according to Fibo numbers, and the seed pods on a pinecone are arranged in a Fibonacci spiral pattern, etc.

Even in the financial markets, Fibonacci ratios are often used to explain how markets move.

There are a few constant ratios in the Fibonacci sequence. The Fibo ratios that matter the most are:

– 161.8%, the “golden ratio” (the ratio between the first number and the one before it, for example, 89/55 = 1.618).

– 61.8% (the ratio of the first number to the second number, like 55/89 = 0.618).

-38.2% (the ratio comes from a division jump of one order, like 55/144 = 0.382).

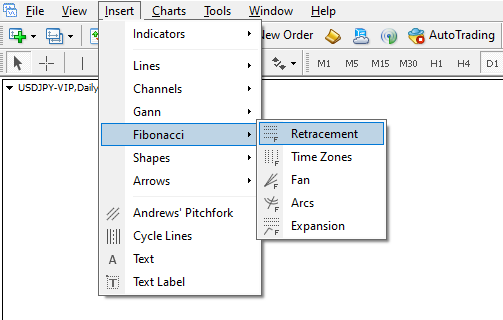
To put it on a chart in MetaTrader, click “Insert” and then “Fibonacci” from the menu. In your trading terminal, you can find the retracement, expansion, fan, arc, and time zone Fibonacci tools. All of these tools use Fibo ratios as their basis.

There are several Fibonacci tools, but Fibo retracement levels and Fibo expansion are used a lot.

Fibonacci retracement levels

Successful traders predict market price fluctuations using several approaches and tools, such as the Fibonacci retracement levels. The Fibonacci retracement lines represent price support and resistance on a price chart, helping traders determine when the price can retrace before continuing the trend.

Formulas for Fibonacci retracement levels

Math is the basis for the Fibonacci retracement tool. You need to use the following formula to find Fibonacci retracement levels:

For an uptrend, UR = H – ((H – L) x percentage); 

or

DR = L + ((H – L) x percentage) for a downtrend.

Where:

UR is a retracement of a trend going up, DR is a retracement of a trend going down, H is a high price, and L is a low price.

Even though most trading platforms can do these calculations for you, it’s good to know how to do it yourself.

How to calculate Fibonacci retracement levels

Now that you know the formula for calculating Fibonacci retracement levels, you can figure out how to do it.

First, look at the price chart and pick two price points—one high and one low. It is essential to make sure that there are no higher highs or lower lows. If you don’t find it right, your calculations won’t be correct, and you won’t find the right retracement level. Then, once you’ve found the high and low, you can use these two numbers in a formula to figure out the retracement levels for a specific area of price action.

What are the ratios of Fibonacci?

However, it’s not enough to know the highs and lows. You also need to know what percentage to put into the formula. Traders use Fibonacci ratios to figure out the levels of Fibonacci retracements.

The Fibonacci ratio is the percentage of the chosen price range that shows where the price movement will stop and start. Fibonacci ratios come from the Fibonacci numbers, a series of numbers where each is the sum of the two numbers before it. If you divide a Fibonacci number by the following number, you get 0.618, which is 61.8%. When you divide the same number by the following number to the right, you get 0.382 (38.2%) and then 0.236 (23.6%). This ratio and 50% are price support and resistance levels, so they are used to find Fibonacci retracement levels.

For instance, the price of an asset goes up from $15 to $18.43. Here’s how to find the Fibonacci retracement levels:

$18.43 – (($18.43 – $15) x percentage)

So, the retracement levels will be $17.62 (at 23.6%), $17.12 (at 38.2%), $16.71 (at 50%), and $16.31 (at 61.8%).

How can you use Fibonacci retracement levels in charts?

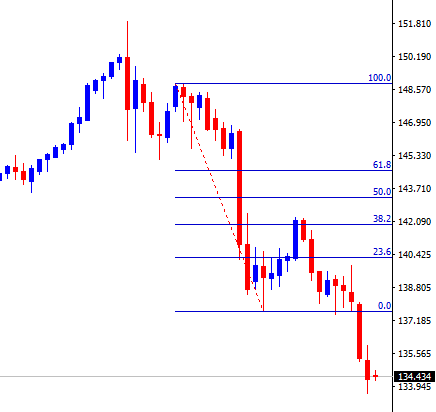
Fibonacci retracement levels can be used to find the best time to enter a trade by looking at charts. After a steady trade, the most common way to use this tool is to see if the price goes back to one of the Fibonacci levels. 

For example, if the cost of an asset drops 23.6% after a significant rise and then goes back up, it might be an excellent time to trade.

How to draw the retracements of Fibonacci?

Even though Fibonacci retracement levels are hard to explain, they are seen as a reliable way to predict how prices will move, primarily when used with other methods of technical analysis. 

However, some traders may find it hard to draw Fibonacci retracement lines because once done incorrectly, they can lead you to the wrong conclusions and mess up your whole trade. 

That is why it’s essential to know how to draw Fibonacci retracements correctly.

Most trading platforms already include the Fibonacci tool, so you don’t have to draw the lines and levels by hand. You must look at how prices have moved in the past and pick the swing highs and lows. 

Then, to draw a line, you need to move your cursor from low to high (for an uptrend) or high to low (for a downtrend).

Intermediate 9: Understanding Bollinger Band

What Is the Bollinger Band Indicator?

A Bollinger Band is a technical analysis tool consisting of a set of trendlines drawn to two standard deviations (up and down) from the simple moving average (SMA) of an instrument’s price. Traders can change these trendlines to suit their needs.

Bollinger Bands were made by the famous technical trader, John Bollinger, who owns their rights. The tool is intended to help investors identify market trends to determine when an asset has been oversold or overbought.

A Bollinger Band has three critical parts: 

  • Middle Band – a simple moving average
  • Lower Band – two standard deviations below the Middle Band
  • Upper Band – two standard deviations above the Middle Band. 

Note that the standard deviation determines the market’s probable movement range.

Bollinger Band charts

How to read Bollinger Bands 

Since the middle band is the same as the simple moving average, we can tell where the trend is going by understanding the concept of Moving Average from the previous lessons.

Knowing how to read the upper and lower bands is essential. Traders usually look at the upper band to see if the market is too high. 

Most of the time, if a price touches the Bollinger Bands, the price may be overbought. In the same way, the lower band shows a possible overbought level.

Bollinger Band charts

However, many new traders make the mistake of thinking that when they hear the words “overbought” or “oversold,” they must enter a reversal position immediately. Even though this isn’t always the case since overbought levels are estimates based on the past, there is a chance that more people will buy, and the trend will continue.

Bollinger Band charts

The image shows an oversold condition that doesn’t change immediately and keeps going lower before going up. This is because sellers keep coming in even though the lower band has already been hit.

It is crucial to confirm whether they are at overbought or oversold levels. In this case, we can use other indicators like the Stochastic or RSI, the price action, or the Bollinger Bands themselves.

Confirmation with Stochastic / RSI Oscillator

When a price moves from below the middle band to above the middle band, we can look at the Stochastic or RSI to see if it is in the middle or lower than level 50. If so, we can state that the increasing trend has been confirmed.

Bollinger Band charts

When the price reaches the top band, we may check the Stochastic or RSI to see if it is also in the overbought zone. If so, we can confirm that the price is indeed in the overbought zone.

Bollinger Band charts

Looking at the image above, we can see that both the Bollinger and the Stochastic Indicator show that the price is overbought, indicating that the Gold price might be slowing down from the upward movement.

However, we recommend that you wait to enter a reverse position.

Confirmation within the Bollinger Band

Bollinger Band charts

The Bollinger Bands can be confirmed by observing whether the band is widening or narrowing. If the price is above the upper Bollinger Band and the two bands are expanding, this indicates that the price will continue to rise. However, when we observe that the Bollinger band has begun to narrow, although the price is at the upper Bollinger, this is confirmation that the price will reverse lower.

Similarly, a further decrease will occur if the price is at the lower Bollinger with the extended band. However, a price reversal to the upside is highly probable when the band has begun to narrow.

Combining the Bollinger Band with trendline

In this strategy, we use Bollinger Bands and trendlines.

Bollinger Band charts

The image shows that the trendline is formed from the highest point and the next lower high but is controlled by the middle band.

The trading strategy is straightforward. If we observe that the price is in the upper band but below the trendline, indicating that the price is no longer able to rise and that it is time for the decrease to continue, there may be a few breaks as long as the price remains in the upper band and is not too far from the trendline. The potential will, after that, continue to decrease.

Bollinger Band charts

When the price breaks above the trendline near the middle band, the price begins to change the trend.

We may expect another movement. If the middle band crosses above the trendline, the downtrend is considered to have ended.

Bollinger Band charts

VT Markets Clinches Three Awards for Their Outstanding Trading Platforms and Services

VT Markets, an international multi-asset broker, is showing great promise on the back of their separation from Vantage Group. They have recently clinched three awards by Global Business Magazine Awards for their exceptional trading platforms and services.

VT Markets’ unique value proposition, in-depth market insights and thorough understanding of the market have rightly earned them both the Best Research House Europe 2022 and Best Forex Broker Australia 2022 awards. In addition, VT Markets’ client-centric approach and unwavering commitment to helping traders achieve their investment goals, give investors confidence that their needs will always be at the forefront of the company’s initiatives.

On winning the Most Innovative Online Trading Platform Europe 2022 award, a VT spokesperson said, “We are extremely proud that VT Markets is being acknowledged for our quality services and reliable trading platforms. In the past year, VT Markets has seen rapid growth from our global expansion strategy. Our team has also launched innovative digital initiatives on our client portal and mobile app, leveraging our robust IT infrastructure and in-house talents. Our trading platform is constantly being optimised to stay ahead of the competition.”

“Clinching these awards is a testament to how VT Markets is fully committed to serving our clients as best we can. We have always been focused on making trading easy and in 2023, we will continue to innovate and ensure our clients are satisfied with our services,” added the company representative.

For more information, visit https://www.vtmarkets.com/.

About the company:

VT Markets is a regulated multi-asset broker with a presence in over 160 countries. The broker has won many international accolades including Best Customer Service and Fastest Growing Broker. Their mission is to make trading an easy, accessible, and seamless experience for everyone.

Week ahead: Will RBNZ continue to raise rates amid stronger domestic activities?

The Reserve Bank of New Zealand (RBNZ) raised its official cash rate in October by 50bps, its fifth increase since late last year. It follows a string of robust economic reports showing that domestic activities have strengthened. Will the central bank raise rates by another 75bps as forecasted?

Here is a roundup of the latest financial news for this week:

RBNZ Rate Statement (23 November)

In October, the Reserve Bank of New Zealand increased its official cash rate to 3.5%, the first raise since April 2015.

Inflation has been low in recent years, but domestic economic activities may have picked up in Q3 2022 as employment continues to rise. However, the value of purchases of durable goods such as consumer electronics and vehicles has decreased in recent years.

Analysts predict RBNZ will add another 75bps to the rate at this month’s meeting.

French Flash Services PMI (23 November)

The French Services Purchasing Managers’ Index dropped to 51.7 in October from a flash reading of 51.3 but down from 52.9 in September.

The business confidence index fell to its lowest level in almost two years, reflecting concerns over persistently high inflation and a drop in investment appetite.

German Flash Manufacturing and Services PMI (23 November)

In October, Germany’s Manufacturing Purchasing Managers’ Index declined to 45.1 from a preliminary estimate of 45.7, indicating the fourth consecutive month of falling factory activity and the most significant contraction since May 2020.

The Services PMI increased to 46.5 in October, compared to the previous month’s 28-month low of 45.0.

Analysts predict the Flash Manufacturing PMI to climb to 45.9 and the Services PMI to increase to 47.5.

UK Flash Manufacturing and Services PMI (23 November)

October’s UK Manufacturing Purchasing Managers Index increased to 46.2 and points to the steepest pace of contraction since May 2020.

UK Services PMI also climbed to 48.8, from a preliminary reading of 47.5 and the first overall decline in output since February 2021.

Analysts forecast both Flash Manufacturing and Services PMIs to be 47.2.

US Flash Services PMI (23 November)

The October US Flash Services PMI rose to 47.8, compared with 49.3 in the previous month. The reading was better than the preliminary estimate of 46.6.

We expect the next Flash Services reading to be 49.3.

FOMC Meeting Minutes (24 November)

In November, the Fed raised its target for the federal funds rate by 75bps to 3.75%-4%, making its highest level since 2008. The board aims to achieve a stance of monetary policy consistent with 2% inflation and maximum employment.

Notification of Server Upgrade

Dear Client,

As part of our commitment to provide the most reliable service to our clients, there will be server maintenance this weekend.

Maintenance Hours :

2022/11/19 11:00 – 15:00 (Server time)

Please note that the following aspects might be affected during the maintenance:

During this weekend’s maintenance period, clients can still trade as usual

However, the stability of quotations and market liquidity will be affected and decreased.

Thank you for your patience and understanding about this important initiative.

If you’d like more information, please don’t hesitate to contact cs@vtmarkets.com

The Adjustment Of Weekly Dividend Notification

Dear Client,

Warmly reminds you that the component stocks in the stock index spot generate dividends. When dividends are distributed, VT Markets will make dividends and deductions for the clients who hold the trading products after the close of the day before the ex-dividend date.

Indices dividends will not be paid/charged as an inclusion along with the swap component. It will be executed separately through a balance statement directly to your trading account, the comment for which will be in the following format “Div & Product Name & Net Volume ”.

Please note the specific adjustments as follows:

The above data is for reference only, please refer to the MT4/MT5 software for specific data.

If you’d like more information, please don’t hesitate to contact cs@vtmarkets.com.

VT Markets Launches Affiliate Challenger Cup With US$25,000 Prize Pool

VT Markets, a top-rated brokerage firm, has launched the VT Affiliate Challenger Cup 2022 (ACC 2022), a competition that rewards affiliates for referring new clients to their platform.

The ACC 2022 is open to VT Markets’ CPA Affiliates, Introducing Brokers or Hybrid program in over 60 countries from the Europe, Middle East, Africa (EMEA) and LATAM regions. Attractive cash prizes will be given to the best-performing affiliates. The champion will secure US$15,000, with the 1st and 2nd runners-up set to receive US$7,500 and US$3,000 respectively.

“At VT Markets, we attribute a big part of our success to our close partnership with the affiliates and IBs. This competition is part of our plan to strengthen ties with our loyal affiliates, as well as to enhance and expand our affiliate program. We believe it is also a great motivation for our affiliates to grow their business network and be appropriately rewarded for their referral initiatives,” commented John Georgiou, Director of Business at VT Markets.

In order to maximise their chances of winning, affiliates will be challenged to devise strategic business plans to boost the amount of deposits and trades made by their referrals. All affiliates will still be eligible to earn their regular referral commissions throughout the program. 

The competition runs from 1 November 2022 to 28 February 2023. 

For more information, you may refer to https://www.vtaffiliates.com/challenger-cup-2022/ 

About VT Markets

VT Markets is a regulated multi-asset broker with a presence in over 160 countries. The broker has won many international accolades including Best Customer Service and Fastest Growing Broker. Their mission is to make trading an easy, accessible, and seamless experience for everyone.

Find out more about VT Markets via http://eu.vtmarkets.com/en-eu. For more details about this competition, please contact partnerships@vtmarkets.com

Week ahead: US retail sales and PPI data may affect December Fed rate decision

The US Federal Reserve will weigh this week’s Retail Sales and PPI data against last week’s lower-than-expected inflation figures as it determines whether to raise its benchmark interest rate by 50bps or 75bps at its December meeting.

Here are the highlights for the week ahead:

RBA Monetary Policy Meeting Minutes (15 November)

The Reserve Bank of Australia (RBA) increased its cash rate to 2.85% at its November meeting, the sixth consecutive increase.

RBA reiterated its commitment to bringing inflation back to target levels and stated that it would do everything in its power to accomplish it. The incoming data will affect the size and timing of rate hikes.

US Empire State Manufacturing Index (15 November)

October’s NY Empire State Manufacturing Index dropped 7.6 points to -9.1, a third consecutive month of negative growth.

Industry experts believe that business conditions will remain the same over the next six months. Meanwhile, this month, data is projected to decrease to -12 points.

US Producer Price Index (15 November)

US PPI for final demand rose 0.4% month-on-month in September 2022, reversing three consecutive months of decline.

Analysts expect that the index will increase by another 0.3% in October.

UK Consumer Price Index (16 November)

In September, the UK’s inflation rate rose to 10.1% from 9.9% in August, returning to 40-year highs seen in July.

According to analysts, they can foresee October’s annual CPI to be higher than 10.4%.

Canada Consumer Price Index (16 November)

According to the latest data, the Consumer Price Index in Canada increased by 0.10% in September 2022 over the previous month. 

Further increases are predicted for October.

US Retail Sales (16 November)

In September 2022, retail sales in the US held steady as high inflation and rising borrowing costs dampened consumer demand.

Retail sales are projected to increase by 0.8% in October.

Australia Employment Data (17 November)

Employment in Australia increased by 900 in September to a record high of 13.59 million. The unemployment rate held steady at 3.5%. Analysts expect employment to rise by 32,000 in October.

Analysts predict that employment will rise by 32,000 in October, and the unemployment rate will be 3.4%.

Back To Top
server

Bonjour 👋

Comment puis-je vous aider ?

Discutez immédiatement avec notre équipe

Chat en direct

Démarrez une conversation en direct via...

  • Telegram
    hold En attente
  • Bientôt disponible...

Bonjour 👋

Comment puis-je vous aider ?

Telegram

Scannez le code QR avec votre smartphone pour démarrer un chat avec nous, ou cliquez ici.

Vous n’avez pas l’application ou la version de bureau de Telegram installée ? Utilisez plutôt Telegram Web .

QR code