To provide a more favorable trading environment to our clients, VT Markets will modify the contract size of the following products:
1. The contract size of HK50ft will be 1.
2. The contract size of EOSUSD, XLMUSD will be 10,000.
The modifications will be put into effect from 2022/08/13:
The above data is for reference only, please refer to the MT4/MT5 software for specific data.
Friendly reminders:
1. All specifications of the above products stay the same except contract size.
2. The lots of each client’s open positions on HK50ft will multiply by 10 after the modification. The lots that exceed the maximal volume will be split into a new position.
3. For the part of the position that is lower than the minimum lot size after the modification, they will be automatically closed at the EOD price on 2022/08/12.
If you’d like more information, please don’t hesitate to contact cs@vtmarkets.com.
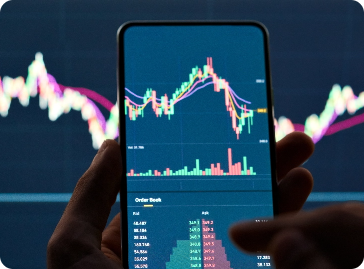
Successful trading doesn’t happen overnight. You need to learn many concepts and strategies to build a good foundation on which you would base your decisions every trading day.
In technical analysis, the moving average is one of the most crucial indicators you need to know about and learn.
What is a moving average?
A moving average is a type of calculation used for analysing data points through a series of averages from different subsets that belong to an entire data set.
The moving average of an instrument is calculated to create an updated average price that will help analysts determine any short-term price fluctuations that could affect trading. It is also a useful technical indicator of a trend and its direction, so you’ll know if you should buy, sell, or pass.
What are the types of moving averages?
There are two basic forms of moving averages: Simple Moving Average (SMA) and Exponential Moving Average (EMA).
Simple Moving Average (SMA)
SMA is a straightforward process of summing up past data points in a set and dividing the total by the number of periods. Traders use this technical indicator to determine when they should join and leave a market on a trading day. With the SMA method, a trader can identify support and resistance prices, which are crucial in knowing when to buy or sell.
Exponential Moving Average (EMA)
EMA, on the other hand, relies on the most recent price points, so it’s more responsive to current price fluctuations. EMA starts by summing up the security’s closing prices for a given period and dividing that by the number of periods. Then, the multiplier is calculated using the formula:
(Multiplier = [2/ (10+1)] – 0.1818)
After that, EMA is calculated by taking the period from the initial EMA up to the most recent period using the multiplier, the price, and the previous period’s EMA value.
The formula for this is:
Current EMA = [Closing Price – EMA (Previous Time Period)] x Multiplier + EMA (Previous Time Period)
What are the benefits of using a moving average?
Although using the moving average method may take some time, many traders have been using it for years as it helps them make the right decisions with their trade. For one, this strategy keeps your analysis straightforward on a price chart by cutting down unnecessary data.
If you look at the moving average, you’ll know if the price is moving up or down. This move can help you decide whether to buy, sell, or sit the market out for a while.
Technical analysts also use the moving average to determine support or resistance in the long term. In an uptrend, the moving average can serve as the support where the prices bounce from. In a downtrend, the moving average will act as the resistance where the price hits and drops again.
2 Common Uses of Moving Average
Using Moving Averages as Trend Indicators
The most common use of Moving Average is to determine where the trend is moving, whether Downtrend, Uptrend or Reversal.
There are 2 ways to do this:
Solely with 1 moving average
Some traders use only one Moving Average by looking at the candles (price). If the price moves above the Moving Average, sloping higher, they believe the trend is an uptrend.
If the price moves below the moving average, sloping down, they believe the trend is a downtrend.
Using 2 Moving Averages
Other traders use 2 Moving Averages (slower- and faster-moving averages) and the candles (price) to know where the market is going and if there is a potential reversal.
If the candle (price) moves above the 2 Moving Averages and the faster-moving average is above the slower-moving average, they believe the trend is an uptrend.
If the candle (price) moves below the 2 Moving Averages and the faster-moving average is below the slower-moving average, they believe the trend is a downtrend.
Using 2 Moving Averages allows traders to determine when a trend has a potential reversal. If there’s a cross between the moving averages, there’s a possible reversal, or at least the trend is slower.
Using Moving Averages as Support and Resistance Levels
Another common use of a Moving Average is to find the support and resistance levels in a moving trend.
Usually, traders use 2 Moving Averages.
If the candle (price) moves above the 2 Moving Averages and the faster-moving average is above the slower-moving average, they believe the trend is still an uptrend. Then we can use the Moving Averages as the Support levels.
If the candle (price) moves below the 2 Moving Averages and the faster-moving average is below the slower moving average, they believe the trend is a downtrend. Then we can use the Moving Averages as the Resistance levels.
Conclusion
If you want to learn all about moving averages, it’s a must to study this method and ask for advice from traders who have been using it for a while. You can also tap into the expertise of a Forex broker for guidance.
Of course, it would be highly beneficial to join a community for trading updates, market changes, and strategies to help you maximise your trading day and earn the best returns from your investment.
New contracts will automatically be rolled over as follows:
Please note:
•The rollover will be automatic, and any existing open positions will remain open.
•Positions that are open on the expiration date will be adjusted via a rollover charge or credit to reflect the price difference between the expiring and new contracts.
•To avoid CFD rollovers, clients can choose to close any open CFD positions prior to the expiration date.
•Clients should ensure that take profits and stop losses are adjusted before this rollover occurs.
If you’d like more information, please don’t hesitate to contact cs@vtmarkets.com.
Warmly reminds you that the component stocks in the stock index spot generate dividends. When dividends are distributed, VT Markets will make dividends and deductions for the clients who hold the trading products after the close of the day before the ex-dividend date.
Indices dividends will not be paid/charged as an inclusion along with the swap component. It will be executed separately through a balance statement directly to your trading account, the comment for which will be in the following format “Div & Product Name & Net Volume ”.
Please note the specific adjustments as follows:
The above data is for reference only, please refer to the MT4/MT5 software for specific data.
If you’d like more information, please don’t hesitate to contact cs@vtmarkets.com.
Best Affiliate Programme, Ultimate Fintech Awards 2022
VT Markets, the international multi-asset broker, is proud to announce that it has clinched the “Best Affiliate Program” at the prestigious Ultimate Fintech Awards 2022, hosted by iFX EXPO International. This globally respected award recognises VT Markets’ large and trusted affiliate network across the world.
VT Markets’ impeccable industry-leading Affiliate Partnership programme consistently delivers innovative trading product and service offerings, attractive and transparent commissions, advanced marketing and institutional solutions designed to ensure the success of its affiliates.
Yiangos Georgiou, Director of Business Development, comments: “Fostering successful affiliate partnerships has always been one of our top priorities as we understand the importance of our international affiliates in expanding our markets globally. We are committed to developing and nurturing these partnerships to help our affiliates achieve sustainable growth as an essential part of our global expansion journey.”
Best Mobile App Europe 2022 (Forex Division)
VT Markets won the “Best Mobile App Europe 2022 (Forex Division)” award with its recently relaunched trading app. It is recognised for creating a secure and integrated trading app that stays true to the brand promise of “Trading can be easy”.
It provides clients with real-time price alerts, performance analytics and smart signals newsletter. It gives in-depth product information with corresponding market analysis and economic news. The enhanced user interface offers excellent accessibility and over 80 payment methods.
An exciting new feature is “Big Movers” which alerts clients on major market shifts and trading opportunities in the previous 24 hours. The “Learn” feature provides valuable educational trading content.
Timothy Lee, Integrated App Marketing Manager comments: “VT Markets has made tremendous investments to bring significant improvements to our mobile offerings and trading platform and this is reflected in the positive feedback from our global clients since our app relaunch. We will continue to invest in innovative features to provide the most optimal trading experience for all our clients.”
The VT Markets trading app is available for download from the Apple App Store and Google Play Store.
Other Awards
VT Markets have received numerous awards this year that recognises it as the innovative market leader in the industry:
Best Forex Broker Europe 2022, International Business Magazine
Best Partnership Programme Global 2022, Global Business Review Magazine
Best Customer Support UK 2022, World Business Outlook Awards
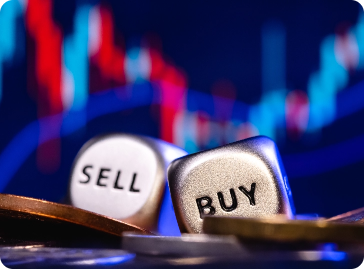
You hear these words a lot from traders—support and resistance. And if you’re new to trading, you’re probably wondering what they mean and how they can help you make the best trading decisions.
In its essence, support means that a downtrend may stop because of increased buying interest or demand. Resistance means that an uptrend is expected to pause due to an increased selling interest.
Here are some of the most important things that you need to know about support and resistance:
Trendlines.These are angled or horizontal lines highlighting support and resistance in a chart. If you’re in an uptrend, there are higher highs and higher lows, while in a downtrend, there are lower lows and lower highs. You need to connect those highs and lows during a trend and extend that line to the right of the chart to determine where the price may reach support or resistance at some point. Trendlines are very important because they help you decide when to buy or sell.
Major and minor. Support and resistance levels can be classified as major and minor, which means that a trend can fluctuate from going down low and suddenly bouncing up before going back down again. If this happens, you call it a minor support area. If the situation follows an uptrend, you call that a major resistance area. Knowing your major and minor support and resistance levels will allow you to see potential trading opportunities so you can take advantage of them and not get left behind by the pack.
False breakouts. Although support and resistance levels are highly reliable determinants for buying, selling, or sitting the market out, there are some instances when prices will move slightly further than expected—a phenomenon called a false breakout. Since support and resistance are not exact prices, you can expect that price analysis could be lower or higher than the real price. While this could cause some risks to you as a trader, some experts would say this is a great opportunity to trade. If you know how to identify a false breakout, you can wait for it to occur on the chart and only enter the market after it happens. That will help you ensure a better trade while still following your analysis based on support and resistance levels.
Trading decisions. The trick to taking advantage of opportunities based on support and resistance is to buy near them because you’ll never know when that trend will stop. Keep in mind that trends play a huge role in dictating where things will be for trading, so you need to be keen on looking for those support and resistance opportunities and take advantage of them before they’re gone. This is why it pays to trade in a platform where all the data you need is right in your hands, and you can also ask for expert advice from people who know these levels well.
At the end of the day, being a successful trader will boil down to how dynamic you are in making trading decisions. While there are no hard-and-fast rules to succeeding in trading, there are strategies and methods like support and resistance to guide you through your trading journey.
Learn all these concepts, talk to people within the trading community, and choose a platform where you can nurture yourself as a trader while building your portfolio and growing your investment.
Get in touch with our team at VT Markets to know more about what we can offer to traders like you.
VT Markets relaunches its secure and integrated trading app that offers a seamless online mobile experience. It is designed using the updated technologies to provide clients with the most optimal trading experience with real-time price alerts, performance analytics and smart signals newsletter. Clients benefit from in-depth information about their desired trading product with corresponding market analysis and economic news. They get a weekly summary which provides an analysis of their trading portfolio and performance.
The enhanced user interface offers excellent accessibility. They can easily access their trading positions, accounts, deposits, funds and coupons, place orders and gain access to over 80 payment methods in different countries. Clients can trade on the move and never miss a trading opportunity.
An exciting new feature is “Big Movers” which alerts clients on major market shifts, economic news highlights and trading opportunities in the previous 24 hours. This gives key market insights and analysis to a tech savvy audience to empower them to make more informed and timely trading decisions. VT Markets invests in the success and learning journey of its clients by developing an extensive “Learn” feature in the app to provide valuable educational content to continuously expand their trading knowledge and expertise.
Timothy Lee, Integrated App Marketing Manager comments: “VT Markets has made tremendous investments to bring significant improvements to our mobile offerings and trading platform and this is reflected in the positive feedback from our global clients since our app relaunch. We are delighted to receive Best Mobile App Europe 2022 and will continue to invest in innovative new features to deliver top-class customer service to our clients allowing them to trade with ease wherever they are. With a clear vision of a multi-asset global trading app and more exciting features like in-app promotions and educational videos planned for the upcoming months, we strive to provide the most optimal trading experience and make trading easy for all our clients.”
The VT Markets trading app is available for download from the Apple App Store and Google Play Store.
VT Markets is a global, regulated, multi-asset broker with experience and expertise in financial markets in over 160 countries. It believes that trading should be accessible and easy and aims to provide their clients with a superior and trusted trading environment, offering true ECN accounts with raw spreads, a powerful client portal, and a 24/7 award-winning customer service.
Its next generation platform makes it effortless to invest in more than 1000 assets, including forex, commodities, indices, and CFD shares with transparency and safety. From gold to FX currencies, trades are executed with lightning-fast speed to guarantee low latency orders and improve chances of profitability. It strives to establish its international branding as the innovative market leader in the trading industry.
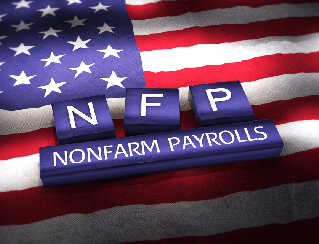
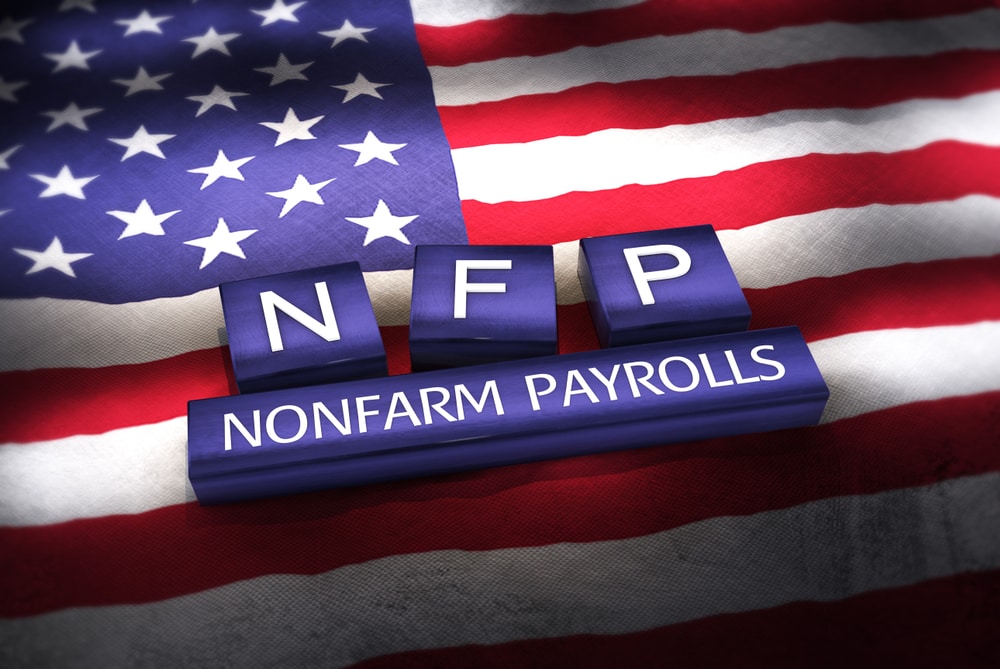
The US market is focusing on Non-Farm employment figures this week. The economy added 372,000 payrolls in June of 2022, which is higher than the market forecast of 268,000. Meanwhile, the July projection is at 255,000 additional jobs.
US unemployment rate remains the same in June 2022 at 3.6%, which is similar to the previous months and remains the lowest since February. Market projections are still at 3.6%.
Investors are also keenly anticipating the interest rate decisions of two major central banks: the Bank of England (BoE) and the Reserve Bank of Australia (RBA).
The Bank of England announced its fifth consecutive interest rate hike in June 2022, with a primary bank rate of 25bps to 1.25%, the largest in 13 years to battle inflation. BoE is committed to decreasing inflation to 2%.
BoE also anticipates an inflation rate of above 9% in the following months and above 11% in October. Meanwhile, the Gross Domestic Product (GDP) growth is expected to go down in the first half of the forecast year, which may lead to a 25bps hike in August.
The Reserve Bank of Australia increased its cash rate by 50 bps to 1.35% in July, following the 50bps hike in June and 25bps hike in May. According to the board, there is no need for massive monetary support given the economy’s strength and price pressures. In addition, they are committed to strengthening the amount and timing guided by incoming data. Market analysts forecast a 50bps hike in August.