Week ahead: Will US, UK and Australia hike interest rates?

The US Federal Reserve, Reserve Bank of Australia, and Bank of England have upcoming interest rate decisions scheduled throughout the week.

New Zealand and Canada will release their Employment Change data, while the US will release its Non-Farm Employment Change figures.

RBA Rate Statement – Australia (1 November)

The Reserve Bank of Australia (RBA) increased the cash rate by 25bps to 2.6% during its October meeting after hiking the benchmark interest rate by 50bps in each of the prior four months and 25 basis points in May.

RBA said that inflation in Australia was too high and that a further increase in prices is expected over the months ahead.

Analysts predict that the RBA will raise another 25bps at this month’s meeting.

ISM Manufacturing PMI – US (1 November)

The ISM Manufacturing PMI decreased in September to 50.9, reflecting the slowest growth in factory activity since 2020.

Based on historical trends, we expect that the index will rise to 51 for October.

Employment Data – New Zealand (2 November)

In the second quarter of 2022, New Zealand’s unemployment rate rose to 3.3% from 3.2% in the previous quarter. Employment data remained unchanged (0%). 

The unemployment rate for the third quarter of 2022 is forecast at 3.2%, with employment data to rise by 0.4%.

FOMC Statement and Fed Funds Rate – US (3 November)

Last month, the Federal Reserve boosted the federal funds rate by 75bps to 3%-3.25%. This increase is the third consecutive three-quarter point increase. 

Analysts expect the Fed to raise its target rate by another 75bps this month.

Bank of England Official Bank Rate and Monetary Policy – UK (3 November)

The Bank of England raised its key interest rate by 50bps to 2.25% in September, marking the 7th consecutive increase.

Analysts expect a further 75bps increase this month.

ISM Services PMI – US (3 November)

The Institute for Supply Management’s Services Purchasing Managers Index declined to 56.7 in September from 56.9 in August, but still above the historical average of 55.

Employment Data – Canada (4 November)

In September 2022, Canada added 21,100 jobs, the first rise in employment since May.

The unemployment rate in Canada declined to 5.2% in September of 2022 from 5.4% in the month before, showing a tight Canadian labour market. 

Analysts expect jobs to reduce by 5,000 in October as well.

Non-Farm Employment Change – US (4 November)

US average hourly earnings held steady at 0.3% in September, as employers added 263,000 jobs and the unemployment rate fell to 3.5%.

Analysts estimate that the average hourly earnings will remain at 0.3% for the month, and an additional 200,000 jobs will be created, with unemployment falling below 3.5%.

Notification of Server Upgrade

Dear Client,

As part of our commitment to provide the most reliable service to our clients,

there will be a server maintenance this weekend.

Maintenance Hours :

2022/10/29 02:00 – 06:00 (Server time)

Please note that the following aspects might be affected during the maintenance:

1. The price quote feature on the Client Portal will be temporarily unavailable. You will not be able to open new positions or close existing positions.

2. There might be a gap between the original price and the price after maintenance. The gaps between Pending Orders, Stop Loss and Take Profit will be filled at the market price once the maintenance is completed.

3. Certain features on the Client Portal will be temporarily unavailable.

4. Please refer to MT4/MT5 for the latest update on the completion and market opening time.

Our services will be back online once the maintenance is completed.

If you’d like more information, please don’t hesitate to contact cs@vtmarkets.com

The Adjustment Of Weekly Dividend Notification

Dear Client,

Warmly reminds you that the component stocks in the stock index spot generate dividends. When dividends are distributed, VT Markets will make dividends and deductions for the clients who hold the trading products after the close of the day before the ex-dividend date.

Indices dividends will not be paid/charged as an inclusion along with the swap component. It will be executed separately through a balance statement directly to your trading account, the comment for which will be in the following format “Div & Product Name & Net Volume ”.

Please note the specific adjustments as follows:

The above data is for reference only, please refer to the MT4/MT5 software for specific data.

If you’d like more information, please don’t hesitate to contact cs@vtmarkets.com.

End of Daylight Saving Time in EU & UK

Dear Client,

With the standard time commencing in the EU and UK on 31 October, there will be changes to the trading hours for certain products on MT4/MT5.

Please refer to the table below outlining the affected instruments:

*All times are provided in GMT+3.

Please note the above data are subject to change. Kindly refer to MT4/MT5 for more details.

If you’d like more information, please don’t hesitate to contact cs@vtmarkets.com.

Intermediate 8: How to use oscillator indicators

Traders often seek indicators to help them determine when they should enter the market. A crucial piece of information for traders is an estimate of how far the market is likely to move before it reaches an area of congestion.

The problem is that many traders spend their time waiting for the market to give them clear direction and hoping that the price will continue. But because there are many opportunities for this “temporary” movement, you will get the best results if you know when the price will stop for a moment—which means you have time to react.

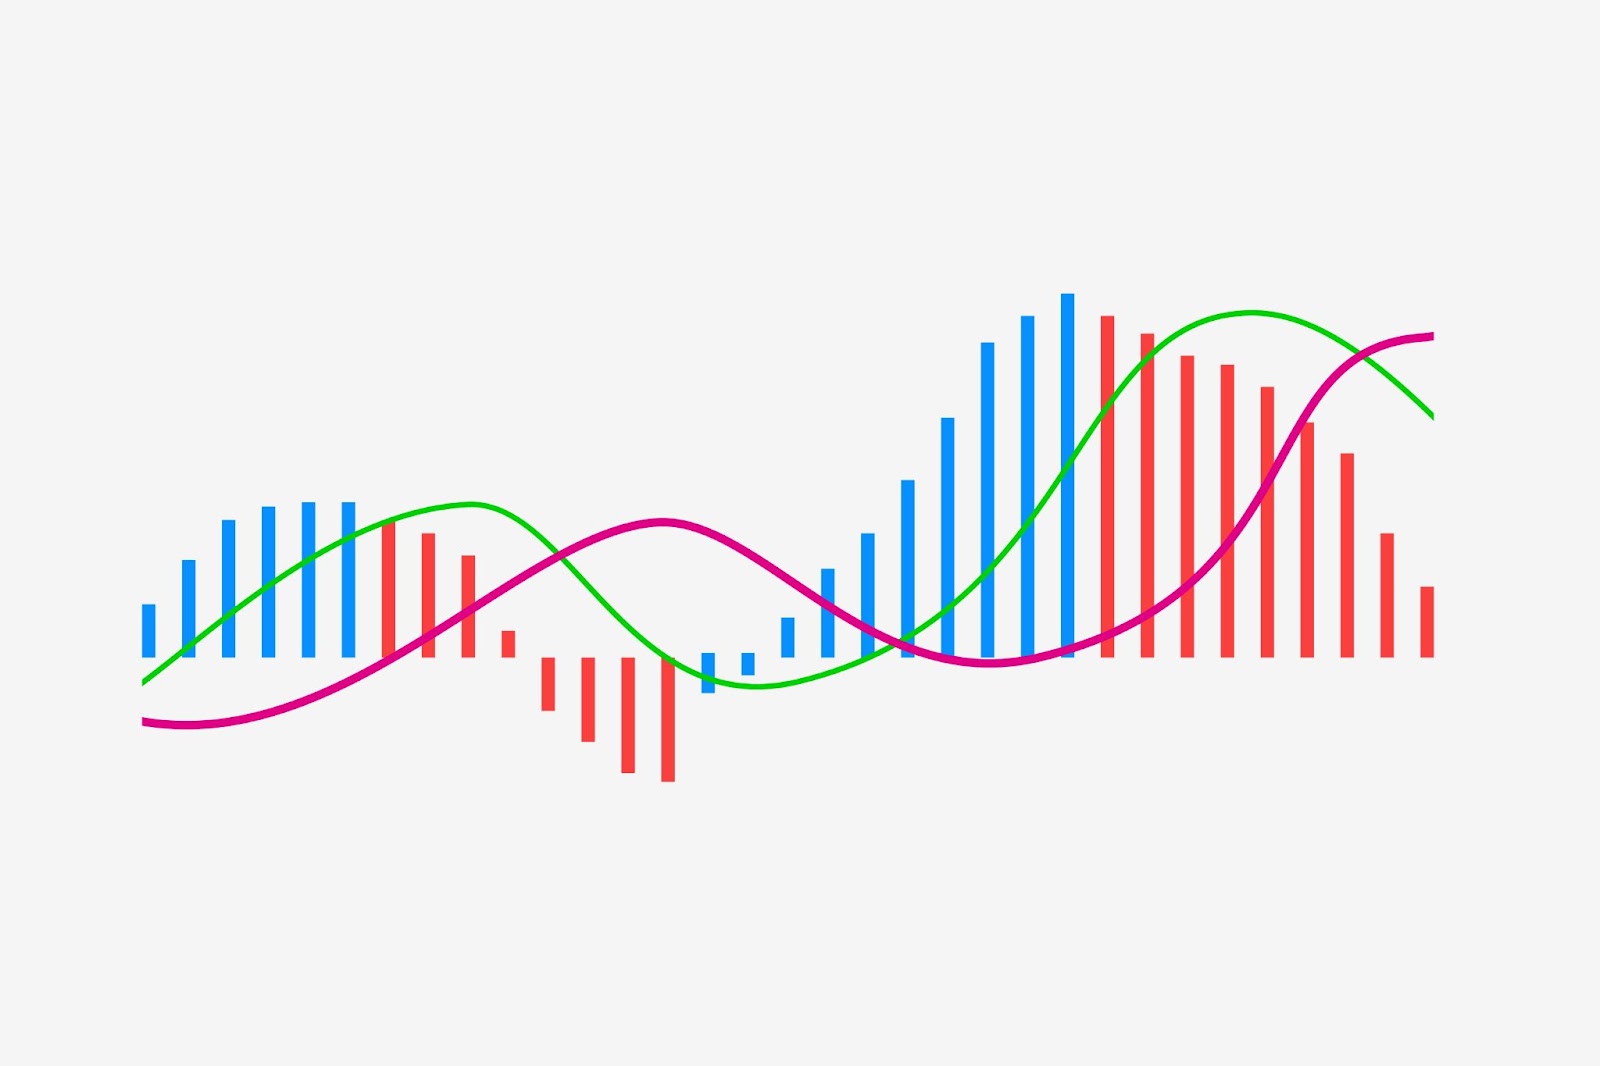
One tool that traders can use to forecast a market’s level of fullness and determine when to sell their positions and buy new ones is called the Oscillator. Oscillators indicate when the market is oversaturated and ready for a reversal. The oscillator shows overbought or oversold levels.

When the oscillator is in the overbought area, it signals that the market is experiencing a surge in demand, and traders should be ready to exit their positions and wait for better moments. When the oscillator is in the oversold area, sellers have become weak, and the downtrend is likely to be oversaturated. This suggests that a bullish reversal might be possible.

However, an oscillator does not always accurately reflect price movement. Traders must be aware that the oscillator reading may be misleading and that a position may have changed even if the oscillator is moving similarly.

In MetaTrader, numerous indicator oscillators are already available for use. The two oscillators that traders frequently use are: 

  • Relative Strength Index 
  • Stochastic Oscillator

The Relative Strength Index (RSI) is one of the traders’ most common technical indicators. In 1978, J. Welles Wilder developed the RSI to measure how fast and how much prices change. This indicator also helps traders know when the market is overbought or oversold, so they can buy at low prices and sell at high prices.

RSI: How to Use It

To add RSI to the chart, click Insert>Indicators>Oscillators>Relative Strength Index.

By default, MetaTrader provides you with 14 periods. You can change this setting however you want. Most traders with short-term objectives use the 9-period RSI, while traders with long-term goals prefer the 25-period RSI. The smaller the period, the more fluctuations the indicator will show.

What does the Relative Strength Index mean?

The Relative Strength Index fluctuates between 0 and 100. A middle line at 50 indicates that there is no trend. If the RSI is above 50, momentum is growing, so you should buy. If the RSI is below 50, bearish momentum will increase, so sell your assets before they decrease in value.

The market is either oversold or overbought. Like any other oscillator, the RSI helps traders know when an asset has been overbought or oversold. 

When the RSI goes above 70, it indicates that a market is overbought and could go down. When the RSI goes below 30, on the other hand, it shows that a market is oversold and could go back up.

However, this method is not recommended for trading when the Relative Strength Index (RSI) shows a trend toward overbought or oversold conditions. If the market trend is strong and appears to be continuing, it is best to sell even though the RSI is oversold during a downtrend or continue buying when the RSI is overbought.

When the indicator leaves a critical level, the quality of RSI signals usually improves, making them more effective when used in the direction of the trend.

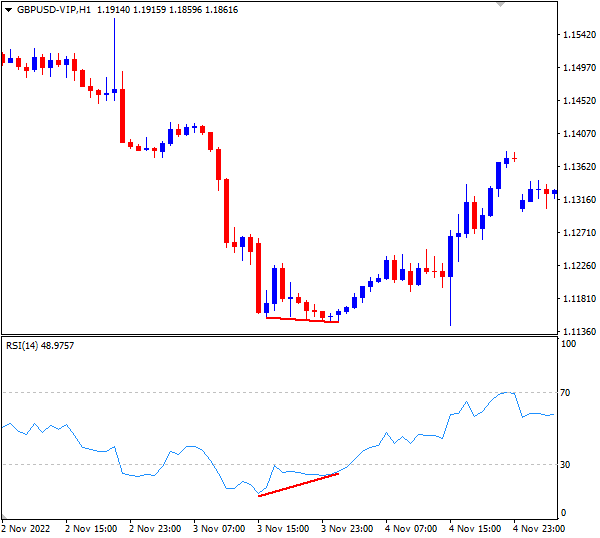
For example, you could buy when the RSI is increasing above 30, and the price is in an uptrend.

Market reversal

When the RSI and the price don’t match up, it can signify that the market is about to change. When the price makes a new high, but the RSI fails to make a corresponding high, this is called a bearish divergence, typically considered a sign of weakness. On the other hand, a bullish divergence forms when the price makes a lower low, but the RSI does not.

Stochastic Oscillator

George C. Lane developed the Stochastic indicator in the late 1950s, and traders use it nowadays. This indicator compares the closing price to past values to measure market momentum. The price will close near the high in a bullish market, and in a bearish market, the low. 

The stochastic oscillator can show overbought or oversold market conditions and indicates a trend change as market momentum slows. Indicators can provide trading signals and suggestions.

Stochastic: How to use it.

MetaTrader has a built-in stochastic indicator. 

Click Insert>Indicators>Oscillators>Stochastic Oscillator to add it to the chart.

A Stochastic Oscillator can be used on any timeframe and can be customized to suit your individual trading system. Standard values are 5, 3, 3, while other popular parameter variations include 14, 3, 3 and 21, 5, 5. 

The 5-day EMA is often referred to as “Fast Stochastic”, as it reacts more quickly with price changes in the market than the slower 14-day EMA (“Slow Stochastic”). Full Stochastic is a hybrid of both EMAs and reacts to changes in both prices and time periods. You can pick the parameters for your own trading system based on your goal.

How does Stochastic Oscillator work?

The stochastic indicator ranges from 0 to 100 in percentage units (%). Two lines represent the indicator:

  • the fast line, also known as %K (solid green line)
  • the slow line, also known as %D. (dotted red line). 

The moving average of %K is the line %D. When the speed changes, these lines meet. When a fast-moving average crosses a slower one from below, it’s a sign to buy. Sell when it crosses a slower one from below.

Like other technical indicators, the Stochastic oscillator does not always provide accurate signals. If you want to improve the accuracy of its signals, there are two options.

Firstly, use the signals made when the crossover happens at the edges (above 80 for a sell signal and below 20 for a buy signal).

One way to trade using an indicator is to look at the longer-term trend on a chart and then trade based on that. For instance, if you are using stochastic on the TF H1 chart and looking at the longer-term trend on the H4 chart. If the uptrend looks strong and you do not want to listen to a sell signal because the price may stay in the overbought area for a long time, pay attention to buy signals that Stochastic gives you, and you may make money from trend trading.

Secondly, pay attention when the oscillator moves away from the price chart. When the price moves up but Stochastic makes a lower high, this is a sell signal (bearish divergence). Conversely, a buy signal shows up when the oscillator doesn’t confirm a new low price.

Intermediate 7: How to set a correct stop loss and avoid stop hunting

In a field where many praise continuous movement, many forget that pushing back is also a strategy. As a trader, your capital is your most valued asset and once it’s gone, it’s never coming back. Thankfully, there are ways to cut your losses and protect your profits. With the right strategy, a Stop Loss can even save your capital for your next investment.

As the name suggests, a stop loss is an order that limits your potential losses from trade and protects the pips from returning to the market. However, while a stop loss is designed to help keep pips in check, many traders do not know how to set a proper one, leading to an ungraceful early exit.

Stop loss forex market volatility

So how does one exactly set a proper stop loss?

While there are other strategies employed in setting stop losses, let’s discuss three fool-proof approaches to setting a proper stop loss: fixed-based, trend-based and volatility-based.

Fixed-based stop loss

The simplest way to set a stop loss is to do a fixed-based stop loss. It’s a stop loss order with set previous we start entering the position based on our money management calculation. For example, when we do some analysis, we know based on the Price Action strategy that we have a level that we want to set as the stop loss level, then we enter based on that level to create a better Risk and Reward trade. So we set the Stop Loss already in that level, then we just let the trade goes, on some certain level we may close our trade manually when we got the profit, or the trade hit the Target Profit level, or after certain movement, we can move the Stop Loss to the Entry Price.

Trend-based stop loss

In a trend-based stop loss, the order is placed at a level that invalidates the current trading set-up. For instance, in an uptrend market, you can identify three points: the lowest, the middle, and the highest downtrend. Using a trend-based approach, a stop loss order may be set on the lowest downtrend for optimal loss cutback, as the price is relatively low compared to that of the highest point. In this approach, identifying where the set-up may fail can help you exit before a bigger loss appears.

Volatility-based stop loss

A volatility-based stop loss, on the other hand, uses a technical analysis indicator called the Average True Range (ATR). Using this approach, the stop loss order is set at an ATR beyond the area of value, which involves two variables: the current ATR value and the swing low value (lowest price point). The current ATR value is simply deducted from the swing low value, resulting in the stop loss level at which you can set your stop loss order.

Pro tip: ATRs can be adjusted in multiples based on your trading set-up. Setting a narrow stop loss widens your position size but puts you at risk of a premature stop-up, whereas setting a wider stop loss may narrow your position size but gives you relatively more stability in controlling your movements.

Stop Losses and Stop Hunting

During a particular time when there is low volatility in the market, many traders use stop hunting as a strategy to open trading opportunities. Stop hunting is a strategy that forces traders to exit by purposely triggering stop loss orders, creating a high-volatility market, and presenting unique short-term trading opportunities which may be profitable for some traders.

For traders holding long-term positions, stop hunting causes continuous losses. In this case, setting the stop loss order at a definite level below support and above resistance can help avoid the occurrence of stop hunting.

Stop Losses in the long run

At the end of the day, a loss is still a loss. However, a small loss is a hundred times better than a burned capital. While it’s true that you can be stopped up from time to time, stop-loss orders not only can protect your capital and your profits, but can also give you time to reevaluate your trading setup to minimize even more losses than that afforded by a stop-loss order.

New Products Launch

Dear Client,

To help you diversify your portfolio, VT Markets is launching another exciting product on 31 October 2022.

Trade BVSPX (Brazil Bovespa Index) with the following specifications:

The above data is for reference only, please refer to the MT4/MT5 software for specific data.

If you’d like more information, please don’t hesitate to contact cs@vtmarkets.com.

Week Ahead: Possible Interest Rate Hikes from Central Banks

This week, the Bank of Canada, the European Central Bank, and the Bank of Japan will announce their interest rate decisions, with expectations of possible rate hikes.

Meanwhile, the US is scheduled to release its Flash Services PMI, Advance GDP, and Core PCE Price Index. The UK and Eurozone will also be releasing their PMIs.

Australia will also release its Consumer Price Index, while Canada is expected to publish its Gross Domestic Product.

Flash Services and Manufacturing PMI – Eurozone, UK and US (24 October)

The Flash Services Purchasing Managers Index (PMI) for France may decline slightly to 51.9 from 52.9 in September, while analysts forecast that Germany will see a decrease in the Flash Services PMI from 45 to 44.8.

The UK’s Flash Services PMI is expected to remain at 50, while the US is forecast to rise from 49.3 to 50.

Germany’s manufacturing PMI for October is forecast to fall to 47 from 47.8 in September. The UK may see a rise to 48.4 from 47.5.

CB Consumer Confidence – US (25 October)

US consumer confidence in September 2022 rose to 108 from 103.6 the previous month. Data also showed that US consumers were optimistic about their finances and the economy in general. 

Analysts expect consumer confidence to slow down slightly over the next few months, but they predict it will remain above 100, indicating that US consumers are still feeling good about the economy.

Consumer Price Index – Australia (26 October)

The Consumer Price Index in Australia rose 1.8% in the 2nd quarter of 2022 over the previous quarter. Analysts forecast a slight dip in CPI for the 3rd quarter, between 1.1% and 1.5%.

Bank of Canada Rate Statement – Canada (26 October)

In September 2022, the Bank of Canada raised its target for its overnight rate by 75bps to 3.25%, saying that rates would need to rise further, given the inflation outlook. In its October meeting, policymakers forecasted that the Bank’s overnight rate would increase by another 50bps to 3.75%.

ECB Press Conference and Interest Rate Decision – Eurozone (27 October)

The European Central Bank raised its main interest rate by 75bps at its September meeting, signalling further hikes in the coming months. The market is already pricing a further 75bps increase in October to 2%.

Advance GDP – US (27 October)

The US economy shrank 0.6% in the second quarter of 2022, matching the second estimate. This confirms that a recession is underway. Economists expect an increase of 2% in the third quarter of 2022.

Bank of Japan Outlook Report – Japan (27 October – tentative)

The Bank of Japan maintained its key short-term interest rate at -0.1% in October and signalled that it would continue to raise rates in future meetings.

Although inflation in Japan is 2.5 to 3%, and the Yen is hitting its weakest level in more than 20 years, we still expect that the interest rate will remain unchanged at -0.1%.

Gross Domestic Product – Canada (28 October)

The gross domestic product (GDP) increased by 0.1% in July, matching the pace of growth in June. The GDP may be slower at 0% in August.

Core PCE Price Index m/m – US (28 October)

The Core PCE prices in the US, excluding food and energy, increased 0.6% in August from its previous month’s revised rate of 0.0%. The consensus estimate is for a 0.4% rise in September.

New Products Launch

Dear Client,

To provide you with more diverse trading options, VT Markets will launch 7 new products on 31 October 2022.

You can now trade the world’s popular futures on MetaTrader 4 and 5 with the following specifications:

The above data is for reference only, please refer to the MT4/MT5 software for specific data.

If you’d like more information, please don’t hesitate to contact cs@vtmarkets.com.

Notification of Server Upgrade

Dear Client,

As part of our commitment to provide the most reliable service to our clients,

there will be a server maintenance this weekend.

Maintenance Hours :

2022/10/22 02:00 – 15:00 (Server time)

Please note that the following aspects might be affected during the maintenance:

1. The price quote feature on the Client Portal will be temporarily unavailable. You will not be able to open new positions or close existing positions.

2. There might be a gap between the original price and the price after maintenance. The gaps between Pending Orders, Stop Loss and Take Profit will be filled at the market price once the maintenance is completed.

3. Certain features on the Client Portal will be temporarily unavailable.

4. Please refer to MT4/MT5 for the latest update on the completion and market opening time.

Our services will be back online once the maintenance is completed.

If you’d like more information, please don’t hesitate to contact cs@vtmarkets.com

Back To Top
server

Bonjour 👋

Comment puis-je vous aider ?

Discutez immédiatement avec notre équipe

Chat en direct

Démarrez une conversation en direct via...

  • Telegram
    hold En attente
  • Bientôt disponible...

Bonjour 👋

Comment puis-je vous aider ?

Telegram

Scannez le code QR avec votre smartphone pour démarrer un chat avec nous, ou cliquez ici.

Vous n’avez pas l’application ou la version de bureau de Telegram installée ? Utilisez plutôt Telegram Web .

QR code