VT Markets, a regulated multi-asset broker, is determined to make its presence in the Middle Eastern market impactful and substantial amidst its global expansion plans.
Forex Expo Dubai 2022 is the largest trading event happening on 19-20 October at the World Trade Center, Dubai. The 2-day event brought industrial leaders, business partners, experts, and traders together to network and explore new opportunities in the ever-evolving Forex landscape.
As the Gold Sponsor, VT Markets was excited to meet new partners and clients, and showcased its latest suite of products and services. The broker focused on promoting its partnership program for introducing brokers and affiliate partners.
John Georgiou, Director of Business at VT Markets, took the stage and presented his insights on “The tactics of global markets”. Georgiou shared his views on the financial markets for the quarter, key economic events, central banks’ monetary policy and inflation.
“We are seeing a growing client base in the Middle East. Forex Expo Dubai is one of the best places to reach out to more traders and exchange ideas with other leaders in the Forex industry. We are glad to be part of this expo and this event has inspired us to continue to lead the action and strive to provide more robust trading solutions for everyone,” said Georgiou.
VT Markets is a regulated multi-asset broker with a presence in over 160 countries. The broker has won multiple international accolades including Best Customer Service and Best Affiliate Program. They aim to make trading an easy, accessible, and seamless experience for everyone.
Warmly reminds you that the component stocks in the stock index spot generate dividends. When dividends are distributed, VT Markets will make dividends and deductions for the clients who hold the trading products after the close of the day before the ex-dividend date.
Indices dividends will not be paid/charged as an inclusion along with the swap component. It will be executed separately through a balance statement directly to your trading account, the comment for which will be in the following format “Div & Product Name & Net Volume ”.
Please note the specific adjustments as follows:
The above data is for reference only, please refer to the MT4/MT5 software for specific data.
If you’d like more information, please don’t hesitate to contact cs@vtmarkets.com.
Candlestick charts existed in Japan for a century before the West even created what we now know as the bar and point-and-figure charts. Steve Nison eventually introduced the candlestick pattern to the West through his book, “Japanese Candlestick Charting Techniques,” and it is still being used widely by traders around the world as one of the most effective technical trading tools that help to predict price direction.
Here’s everything you need to know about the famous candlestick pattern.
What is a candlestick?
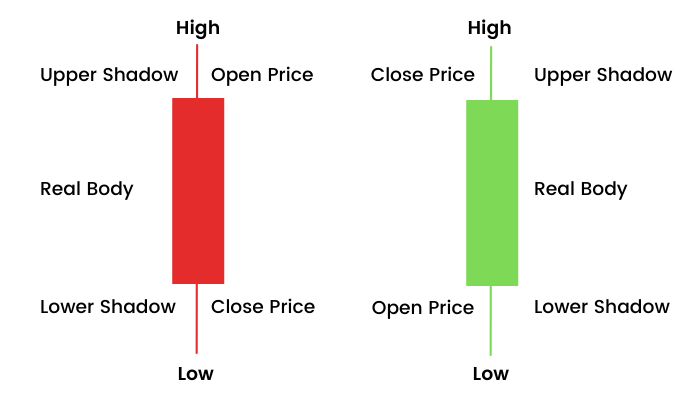
The candlesticks in a candlestick chart are rightly called so because of how they look. A daily candlestick represents a market’s opening, high, low, and closing prices for that trading day. It also has a “real body,” which is essentially the price range between the opening and closing of a trade. If it is empty, it means the closing price is higher than the opening price. If it is filled in, on the other hand, it means that the closing price was lower than the opening price.
In some instances, however, traders shade a down candle with red and an up candle green, which is why you’ll see a colourful candlestick chart.
What are the basic candlestick patterns?
Since candlesticks are created based on the upward and downward movement of prices, they may look random at first glance. But these candlesticks form patterns that traders look into in analysing market movements and making the right trading decisions.
Bullish Candlestick Patterns
Let’s take a look at the bullish candlestick patterns. We are all familiar with the long black line that encompasses a real body and represents an extremely strong movement. This is one of the most attractive patterns that traders want to see on charts.
Here are 5 powerful bullish candlestick patterns:
Bullish engulfing pattern
In a bull market, the bullish engulfing pattern represents when buyers are more in control than the sellers. Here, you’ll see a long green real body engulfing a small real body, which indicates that buyers have more leverage, and prices could go up.
A morning star is a pattern that indicates the start of an upward climb following a downward trend. A bullish signal is generated when three candles appear in a row, with one session showing a long body and the other two forming small bodies. Most traders watch for this signal because it can help predict future market moves up or down.
Three White Soldiers
Three White Soldiers is a bullish candlestick pattern that consists of three consecutive long white candlesticks. This indicates that the bears are losing grip on their control, and the bulls are taking over. The longer the successive candles, the more significant it is. It has one of the highest reliability rates among all reversal candlesticks, with a minimum requirement for at least 3 consecutive white candles to form this pattern.
Hammer
The Hammer Candlestick Pattern is a bullish reversal pattern that signals a potential reversal of the current downtrend. It has a long black body followed by a small white body, with the lower shadow of the black body extending well below its high point. The Hammer is a popular phenomenon for candlestick pattern traders to watch as it can signal an upcoming price change in either direction of an asset’s price action.
The Piercing Pattern
The Piercing Pattern is a bullish reversal pattern, which occurs after a downtrend and signals that the market is reversing to the upside. The first candlestick of this formation is called a white body and has a long upper shadow, while the second one has no shadow at all.
You can use these bullish candlestick patterns to find good entry points. The three white soldiers, for example, is a reversal pattern that indicates the market bottom and the beginning of a new up-trend. A bullish engulfing pattern can be used as an entry point when the price breaks above the resistance level. The morning star pattern has a high probability of success because it forms after a downtrend and signals an upward price movement.
Bearish Candlestick Patterns
Bearish candlestick patterns are used to predict market reversals. A reversal pattern can be thought of as a warning sign that something has changed and it is time to take action. Here are 5 of the most popular bearish candlestick patterns.
Bearish Engulfing Pattern
Like the bear trend, this pattern develops during an uptrend when there are more sellers than buyers. Here, you’ll see a long red real body engulfing a small green real body, which indicates that the sellers have more leverage and prices could go down.
The Hanging Man is a single candlestick with a long lower shadow. This pattern is considered a bearish reversal pattern and can be used for trend reversals and the continuation of a falling market.
The long lower shadow indicates that the price opened higher than it closed but fell during the session. The upper shadow is shorter than the body or wicks, which shows that prices closed near their low for the day. The opening price must be well above the closing price to qualify as a hanging man pattern; otherwise, it would be classified as an evening star instead.
Bearish Evening Star
An evening star is indicative of a topping pattern, which is represented by the last candle on the pattern opening right below the small real body from the previous trading day that can either be red or green. A bearish evening star means buyers are stalling, and there’s more active selling on the market.
Dark Cloud Cover
The Dark Cloud Cover is a bearish pattern that occurs when a small bearish candle follows a large bullish candle, which is completely engulfed by the large bullish candle. The pattern indicates that the bulls are losing momentum and that their price rally may end soon. It’s also considered to be a continuation pattern because it forms after an uptrend has been in place for some time.
Bearish Harami
Indicating that there’s indecision on the part of buyers, a bearish harami is something that you should watch because it can lead to a further uptrend or if a down candle follows the pattern, it could mean that prices will be sliding.
Continuation Candlestick Patterns
Traders use these patterns to confirm market direction and help you make informed buying and selling decisions.
Here are 5 of the most popular patterns.
Doji
The Doji is one of the most widely used and popular candlestick patterns. A Doji is a candlestick with a small body (less than half the length of the previous day’s body) and no upper or lower wick. It is a sign of indecision, which can be interpreted as evidence that buyers and sellers are evenly matched, so there isn’t any clear direction for a price to go in next.
Spinning Top
A spinning top candle is a candlestick with a small body and a long wick. It’s called “spinning top” because it looks like it’s about to fall over but never does.
This pattern is considered either bearish or bullish, depending on the previous market trend and other factors like volume, price action, and open interest in the option you’re trading.
Rising Three Methods
The Rising Three Methods pattern is a bullish reversal pattern that consists of three candles. The first candle on the chart represents the uptrend, while the second and third candles represent a price decline. The third candle closes above the second candle’s midpoint, creating a new high.
The Falling Three Methods
The Falling Three Methods pattern is a reversal pattern consisting of three candles, three long-bodied red (or black) candles followed by two long-bodied green (or white) candles.
The first candle in this pattern is usually a Doji candle or an Engulfing candle. The third and fifth candles can be either Bearish Engulfing Candles or Dark Cloud Cover Candles.
Mat-Hold Candlestick Pattern
Mat-hold candlestick pattern is a bullish reversal pattern that indicates that the bulls are in control. It is made up of a long black candle with a smaller white body and then a Doji candlestick that appears above the high of the first black candle. This means that the bears have been exhausted, and bulls are ready to take over again. To trade this pattern, wait for confirmation signals such as price breaking above resistance levels or falling through support levels after they form within successful patterns like Hanging Man Candlesticks.
Takeaway
Centuries ago, the Japanese discovered that emotions play a huge part in how investors make decisions when trading, and it also influences how assets move. Today, candlestick patterns continue to guide traders on the choices they need to make, depending on how the market is going and the attitude of other traders.
So, if you’re new to trading, make sure that you learn all about candlestick patterns and the other basic strategies that will help you make the right choices. You are making a huge investment, after all, and it only makes sense that you master the craft to succeed.
Candlestick charts are a popular tool used in technical analysis. They are often used to determine possible price movements based on past patterns, during both bull and bear markets.
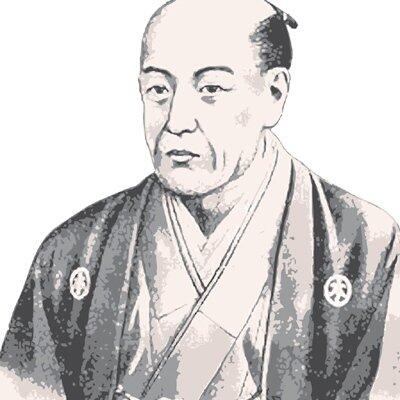
The concept originated in 1700 when a Japanese man named Honma Munehisa discovered that while supply and demand mainly determined the cost of rice, the market was also influenced by emotion.
(Honma Munehisa)
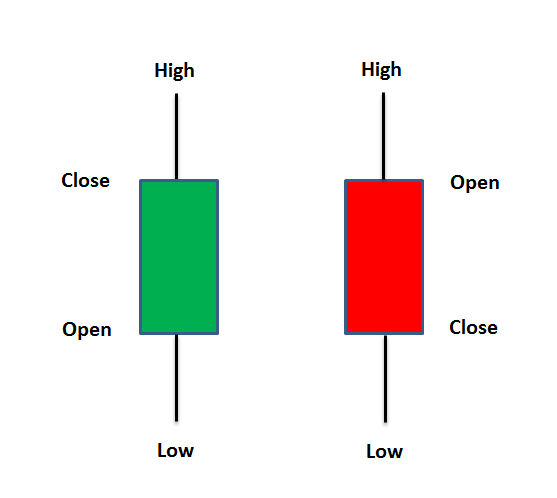
How to read Japanese Candlesticks?
Japanese candlesticks display the following four types of price levels during a single trading session:
High price
Low price
Opening price
Closing price
A green candlestick suggests that the opening price on that day was lower than the closing price, which meant that demand exceeded supply.
Meanwhile, a red candle stick reflects that the closing price on that day was lower than the opening price, which reflects that supply was more than demand.
Japanese candlesticks also contain a real body, and two tails.
Thereal body of a candlestick represents the range between the open and the close price within a single trading session. It is a reflection of the price sentiment during that specific period.
Meanwhile, thetails (upper shadow and lower shadow)represent the highest or lowest price reached during the trading session.
Examples of Japanese Candlestick patterns
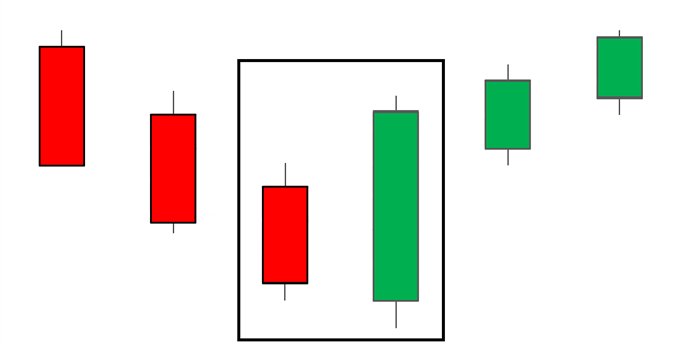
There are many different kinds of candlestick patterns such as bullish patterns, bearish patterns, and continuation patterns.
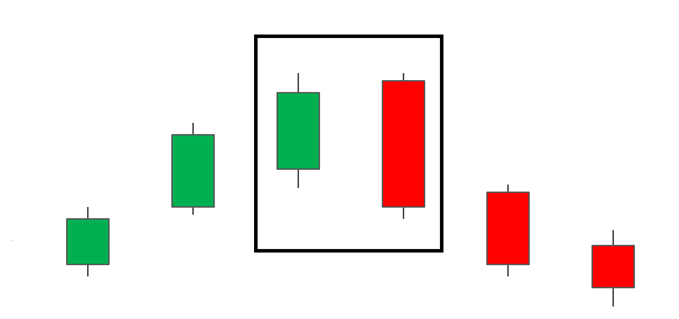
Bullish patterns indicate that price is likely to rise, while bearish patterns suggest that the price is likely to fall.
Bullish Pattern
Bearish Pattern
However, it is important to remember that candlestick patterns should only be used as a reference. Traders will still have to do their own due diligence whenever they trade the markets.
Key economic reports are due for release this week starting with the US Empire State and Philly Fed Manufacturing Index.
Several countries will also release their Consumer Price Index, including the UK, Canada, and New Zealand. Australia will release its employment figures and meeting minutes earlier in the week.
US Empire State Manufacturing Index (17 October)
In August 2022, the New York Empire State Manufacturing Index rose by 30 points to -1.5.
According to a recent survey of businesses, firms were not optimistic that business conditions would improve over the next few months. Analysts expect this month’s unemployment figure to come in at around -1.
New Zealand Consumer Price Index (18 October)
In the first quarter of 2022, the Consumer Price Index in New Zealand rose 1.8%. Analysts expect that CPI in New Zealand will rise another 1.7% for the second quarter of 2022.
Analysts predict that CPI in New Zealand will rise 1.6% for the third quarter of 2022.
Australian Monetary Policy Meeting Minutes (18 October)
The Reserve Bank of Australia (RBA) raised its benchmark interest rate by 25bps to 2.6%, surprising market analysts who had expected the central bank to increase the cash rate by 50 basis points.
Policymakers plan to raise interest rates further, with size and timing to be determined. The committee remains committed to its long-run goal of price stability and will continue to do so until that time comes.
UK Consumer Price Index (19 October)
In August of 2022, the Consumer Price Index in the UK rose 0.5% month-on-month, the smallest gain in seven months.
Analysts expect the figure to rise by 0.30% in September.
Canada Consumer Price Index (19 October)
The consumer price index in Canada fell 0.3% in August, the steepest monthly drop since April 2020. Analysts expect prices to remain unchanged in September.
Australia Employment Change (20 October)
The Australian labour market continued its upward trend in August this year, as employment increased by 33,500 to a new high of 13.59 million. The unemployment rate was at 3.5% in August.
Analysts expect that the Employment report for September will show an increase in jobs of 40,000, accompanied by a return to the unemployment rate of 3.4%.
US Philly Fed Manufacturing Index (20 October)
The US Philadelphia Fed Manufacturing Index fell from 6.2 in August to -9.9 in September.
Analysts predict that the index will fall again this month to -5.
Warmly reminds you that the component stocks in the stock index spot generate dividends. When dividends are distributed, VT Markets will make dividends and deductions for the clients who hold the trading products after the close of the day before the ex-dividend date.
Indices dividends will not be paid/charged as an inclusion along with the swap component. It will be executed separately through a balance statement directly to your trading account, the comment for which will be in the following format “Div & Product Name & Net Volume ”.
Please note the specific adjustments as follows:
The above data is for reference only, please refer to the MT4/MT5 software for specific data.
If you’d like more information, please don’t hesitate to contact cs@vtmarkets.com.
The US will release several key data items this week, including the inflation data reflected in the Consumer Price Index, the producer price index, and retail sales data. The preliminary consumer sentiment data reported by the University of Michigan and the minutes from the Federal Open Market Committee will also be released.
Meanwhile, the UK will publish its GDP data mid-week.
UK Gross Domestic Product (12 October)
Gross domestic product in the UK grew 0.2% in July from June, rebounding from a 0.6% fall in the previous month.
Analysts forecast that the economy will grow 0.1% in August.
US Producer Price Index (12 October)
US producer prices fell 0.1% in August, following a 0.4% drop in July. According to economists, prices are forecast to remain steady (0%) for September.
FOMC Meeting Minutes (13 October)
In its September meeting, the Federal Open Market Committee increased the federal funds rate by 75bps (3%-3.25% range). The Fed also projected that interest rates will rise to as high as 4.4% by December 2022 and stay at 4.6% in 2023.
US Consumer Price Index (13 October)
According to the Bureau of Labour Statistics, the US consumer price index rose 0.1% in August from July. This follows a flat reading in the previous month and is higher than a forecast decline of 0.1%. Analysts expect that September’s CPI will be up by 0.2%.
US Retail Sales (14 October)
The US retail sales increased by 0.3% in August from July, following a revised 0.4% fall in the previous month. Markets expect retail sales figures to increase by 0.2% in the current month.
Prelim UoM Consumer Sentiment (14 October)
In September, the University of Michigan’s consumer sentiment index was released to be 58.6, revised from 59.5 in a preliminary figure. The index had been above 58.2 in August and at its highest in five months.
Analysts predict a range of figures for the index, with some believing it will surpass 58.5, while others believe it will fall below that level.
Written on October 10, 2022 at 12:08 am, by anakin
Warmly reminds you that the component stocks in the stock index spot generate dividends. When dividends are distributed, VT Markets will make dividends and deductions for the clients who hold the trading products after the close of the day before the ex-dividend date.
Indices dividends will not be paid/charged as an inclusion along with the swap component. It will be executed separately through a balance statement directly to your trading account, the comment for which will be in the following format “Div & Product Name & Net Volume ”.
Please note the specific adjustments as follows:
The above data is for reference only, please refer to the MT4/MT5 software for specific data.
If you’d like more information, please don’t hesitate to contact cs@vtmarkets.com.
New contracts will automatically be rolled over as follows:
Please note:
• The rollover will be automatic, and any existing open positions will remain open.
• Positions that are open on the expiration date will be adjusted via a rollover charge or credit to reflect the price difference between the expiring and new contracts.
• To avoid CFD rollovers, clients can choose to close any open CFD positions prior to the expiration date.
• Clients should ensure that take profits and stop losses are adjusted before this rollover occurs.
If you’d like more information, please don’t hesitate to contact cs@vtmarkets.com.